The problem
Eight teams were producing 255 separate Excel reports. Each had grown up around one team's needs, so the same measure could be defined three different ways depending on who built the sheet. Refreshes were manual, lineage was undocumented, and the numbers in two reports rarely agreed. Most of the analytical effort went into rebuilding the reports rather than reading them.
Handling health data made the reporting problem a governance problem too. Access controls sat inside individual files rather than in the platform, so who could see what depended on which spreadsheet they had been sent.
What I did
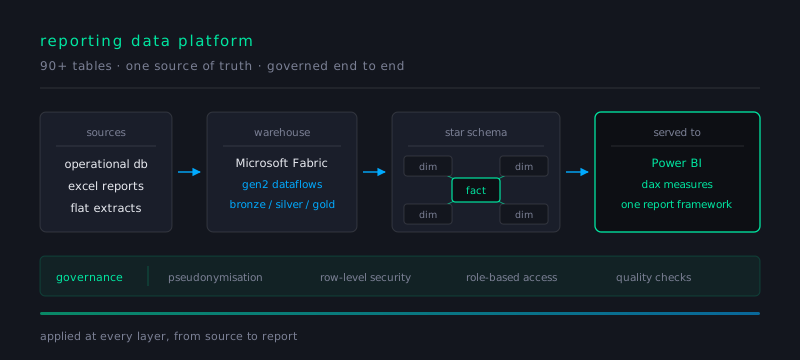
I was a core member of the team that migrated those 255 reports onto a single Power BI framework, built on a cloud data warehouse in Microsoft Fabric. Before any of it could be modelled, the definitions had to be agreed, so I worked with 8 team leads to redefine the KPIs and settle on one version of each measure.
The warehouse took data in through Gen2 Dataflows and automated pipelines, with quality checks at each layer. On top of that I designed star schema models across 90+ tables in SQL, Power Query and DAX, which gave the organisation a single source of truth the reports could all read from.
The saving was not just the hours. Once every report read from the same model, a number meant the same thing in every meeting, and an analyst could answer a new question by writing a measure rather than rebuilding a spreadsheet.
Governance was built into the platform rather than bolted on afterwards: a layered framework of pseudonymisation, row-level security and role-based access control, applied consistently from source through to report, so patient data handling was auditable organisation-wide.
The last part was making it outlive me. I ran SQL and Fabric bootcamps for 6 analysts, training them to a shared coding standard and reviewing their build work, so the framework had people who could extend it.
Technical approach
- Cloud data warehouse in Microsoft Fabric with Gen2 Dataflows
- Automated pipelines with quality checks at each layer
- Star schema modelling across 90+ tables in SQL, Power Query and DAX
- One Power BI framework replacing 255 Excel reports
- Pseudonymisation, row-level security and role-based access control
Outcomes
- 40 hours of team effort saved per week across eight teams
- KPIs redefined once with 8 team leads and applied consistently
- Single source of truth covering 450,000+ records across eight teams
- Auditable, standardised data handling organisation-wide
- 6 analysts trained to a shared coding standard
Why this matters for your organisation
Most reporting problems look like a dashboard problem and turn out to be a definitions problem. If your teams disagree about what a number means, no amount of tooling fixes it, which is why the KPI work with team leads came before the modelling.
This kind of work suits organisations moving off spreadsheet reporting, teams consolidating onto a cloud platform, and anyone handling sensitive data who needs access control to be a property of the platform rather than a property of who was emailed which file.